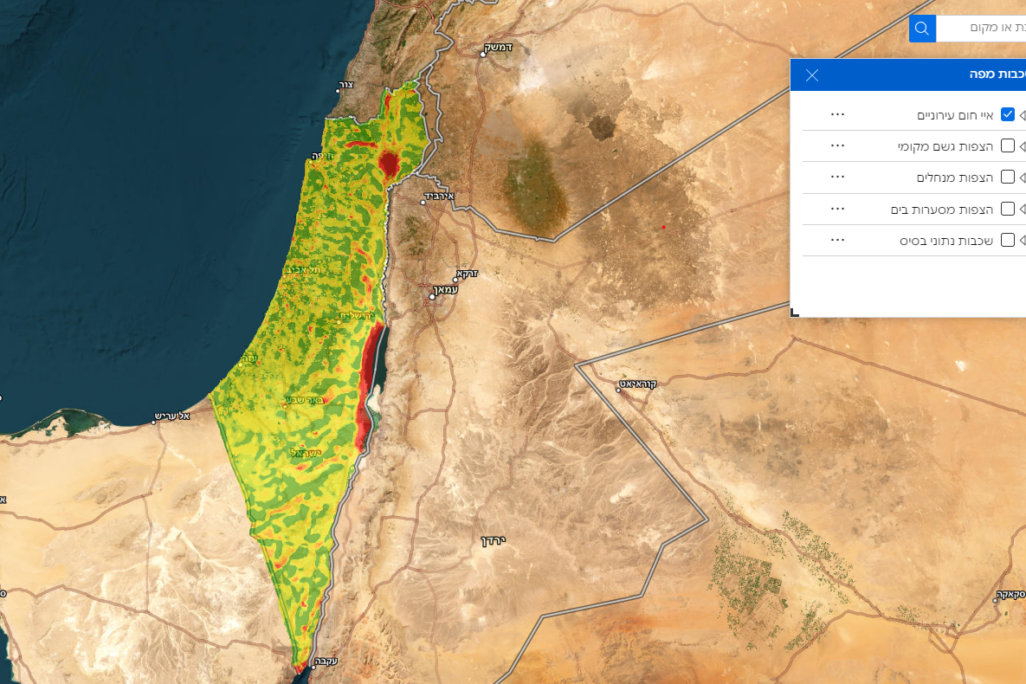
The Ministry of Environmental Protection has released an experimental version of a new tool for environmental mapping called the National Climate Risk Map. The map includes information on environmental threats such as heatwaves, heat stress, and extreme storms at sea. It was developed under the leadership of the ministry's chief scientist, Prof. Noga Kronfeld-Schor, alongside an inter-ministerial steering committee. The map reflects significant differences in vulnerability to extreme climate conditions not only between different regions of the country, but in some cases between different neighborhoods within the same city.
According to data from the Tel Aviv-Yafo municipality, published in the city's 2020 climate change readiness plan, temperature differences between different areas in the city can reach up to 8 degrees Celsius in the summer. Central city residents benefit from heat relief thanks to shading structures, trees, and comfortable sea breezes. But the poorer southeast of the municipality is dotted with "heat islands," areas that are comparatively warmer than their surroundings. Researchers have documented adverse health effects and decreased productivity among workers in such areas. The National Climate Risk Map will enable data of this type to be published for communities throughout the entire country.
The new tool is intended for use by security forces, local authorities, and the general public. It is designed to assist local authorities and national bodies, such as the IDF, in promoting more precise preparedness plans and allocating budgets in a more informed manner.
According to Minister of Environmental Protection Idit Silman, "[i]nformation and mapping can help decision makers, security forces, local authorities, and the public understand climate risks. At the moment there is much uncertainty on the subject. This tool will help us understand the implications of different climatic scenarios. We will continue to refine the program and add more layers of information in collaboration with our own government ministries, international partners, and academia."
The ministry's chief scientist, Prof. Noga Kronfeld-Schor, said that "[t]he maps and tools available on the site will continue to be updated and refined over time in order to help enhance Israel's climate resilience."
In recent years, the frequency and severity of extreme weather events such as heatwaves, fires, and extreme temperatures have increased in Israel and around the world. This situation is expected to continue and worsen in the coming decades. At the same time, long-term changes such as rising sea levels continue to pose a threat .
According to data from the Ministry of Environmental Protection, dozens of cities and towns, covering about 55% of Israel's population, have already begun preparing climate change readiness plans. The ministry defines "vulnerability" as an estimate of the risk of exposure to an extreme event such as a heatwave or flooding. This includes an assessment of sensitivity to damage which takes into account social and economic variables and existing preparedness capacity.
The risk maps include several layers of geographical data, as well as measurements of the elderly population's vulnerability to the impacts of climate change.
There is still much work to be done to improve the map, but the decision to publish now stems from the approach of "good enough data." The goal is to enable rapid preparedness for extreme events, rather than waiting for more meticulous data collection, which will only be possible in the coming years.
According to Kronfeld-Schor, one of the significant risks the map highlights is that areas with a weak economic population may be particularly vulnerable to extreme weather conditions.
A documentary called 'Boiled: Survival by Address' from 2018 followed the story of the 1995 heat wave in Chicago, which caused the deaths of at least 739 people. The majority of the victims lived in impoverished and neglected neighborhoods in the south and west of the city, where primarily non-white populations reside. These neighborhoods became death traps during the prolonged heatwave that lasted several days.
The lethal effect was not caused by an extreme peak in temperatures but rather as a result of the prolonged heatwave: the lack of significant cooling in the evening hours and the continued accumulation of heat day after day. Poverty and life on the social margins leaves more people stuck living inside homes without proper ventilation, drainage, or other structural necessities.
Dr. Steve Whitman, the urban epidemiologist of Chicago at the time, mapped the deaths during the heatwave across the city and found a significant correlation between high shooting areas, abandonment, diabetes, cancer, unemployment, heart diseases, school dropout rates, and low life expectancy with increased mortality from the heatwave.
This article was translated from Hebrew by Etz Greenfeld.


